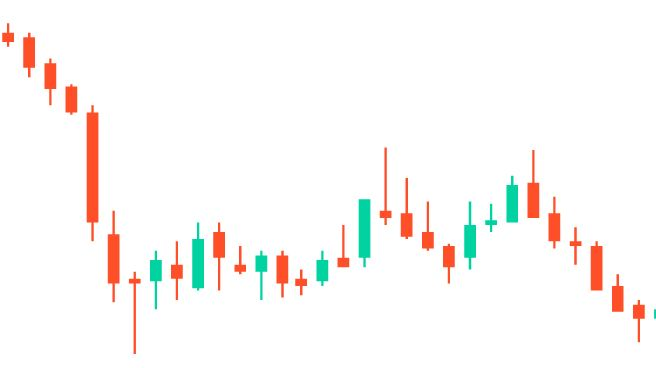
While trading, technical analysis plays a critical role in making informed decisions. There are multiple tools to conduct technical analysis, and one of the most effective is Candlestick Pattern. Candlestick patterns allow traders to understand the market behavior and make better trades. In this blog, we’ll delve deep into discussing how candlestick patterns can be used to make better trades. Let’s dive in!
How to Use Candlestick Patterns for Better Trading?
Here, we’ve mentioned six ways candlestick patterns can help in trading.
1. Identify Trends
Primarily identifying the trend before using candlestick patterns will help you make better trading decisions. Simply put, candlestick patterns generate more efficient results when they align with the ongoing overall trend.
For instance, a bullish candlestick pattern, such as Hammer, is considered to be more effective when it appears during a downward trend and suggests a potential reversal.
In a nutshell, identifying trends prior can help traders avoid false signals and instead make more informed trading decisions. However, identifying these patterns can be a little confusing for beginners, so using a screener for share market would help.
2. Combine Patterns with Technical Indicators
Although candlestick patterns help traders determine potential price movements, combining them with reliable indicators like moving averages, relative strength index, Bollinger Bands, etc., can help you confirm the signals provided by candlestick patterns.
For instance, if the Bullish Engulfing Pattern is formed at the support level and the RSI indicator is indicating an oversold condition, then this two-sided confirmation may allow you to make an informed trading decision.
3. Determine Entry and Exit Points
Candlestick patterns can potentially be used to determine precise entry and exit points in trading.
When candlestick patterns indicate a potential reversal or continuation of the trend, it is considered an entry point.
In contrast, when patterns signal the end of the trend, like the appearance of a Shooting Star in an uptrend, it is considered an Exit point.
Therefore, using candlestick patterns to time the entry and exit points may help you make profitable trades.
4. Understand Market Sentiments
Many candlestick patterns can also be used to understand the emotions of the traders, representing the market sentiments visually.
For instance, the Doji Pattern, in which opening and closing prices are approximately the same, showcases indecision and uncertainty among traders.
Morning Star, which consists of bullish patterns, represents buyers gaining strength. However, Evening Star, which represents bearish patterns, represents selling pressure amongst the traders in the market.
Therefore, using these candlestick patterns can help you gauge whether the market is bullish, bearish, or neutral and also allows you to decide your strategies accordingly.
5. Risk Management
Candlestick patterns are widely used in risk management. These patterns can help you identify potential reversals or continuation, as per which you can set an accurate stop-loss order and limit the potential losses.
In addition to candlestick patterns, you may also use a candlestick stock screener to filter and monitor the chart patterns that properly align with your risk management strategy. This way, you can increase your chances of making profits.
6. Sport Trend Reversals
Last but not least, candlestick patterns can help you spot the trend reversals. The reversal patterns, including Hammer, Shooting Star and Engulfing patterns, can help you easily identify the changes in market direction.
For instance, if a Bearish Engulfing pattern appears at the top of an uptrend, it potentially suggests that the trend may lose strength and now start falling.
Conclusion
In summary, candlestick patterns are one of the effective methods of technical analysis, allowing traders to make better trades. By understanding these charting partners, you can find accurate entry and exit points for trades with ease.


